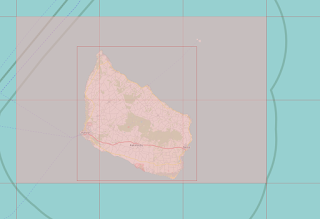
Hello, I'm relatively new to this world. I think my objective is pretty simple but I'm having a little trouble trying to achieve it. What I need: take a part of my city and generate the corresponding tiles for use them offline with GPS data. Basically draw a point at the position I'm in. What I'm doing: first, I'm locating my area with OSM data using Maperitive. I manually draw a bounding area and I generate the tiles. So far everything works fine. The problem: the boundaries I draw don't match with the real tiles boundaries. The resulting JSON contains the boundaries I draw, but not the real tiles boundaries, plus the tiles also don't have matching boundaries between different zoom levels. This makes sense because of the standard division of the world. Just in case, I illustrate with some images that I found and that describe the situation:
The question: is there any way to crop an area and get all the necessary tiles to make them match with the original boundaries? Greetings. asked 28 Feb '22, 10:06 Sergio |


One Answer:
After reading and reading I ended up by resolving my particular problem. The first point is that I wasn't giving it the right focus. It wasn't about the "real tile boundaries" I was talking about, it was about that the tiles are the boundaries. Each tile represent an XYZ point on the global map, and the way Maperitive downloads and stores them is that. It creates the first folder (Z), the sub folders (X) and the files (Y). The nomenclature of every data is the value for the axis. Solution: for knowing in what tile my coordinates were, I just had to transform my Lat, Lon values as the documentation says. Finally, knowing that the image files are 256x256 and starting from the upper left corner, the only thing needed is to know where the point is inside the image multiplying the floating part by 256. I coded a Python solution to get this knowing Lat, Lon: And that's all. I hope this helps someone with no experiencie like me. answered 01 Mar '22, 02:21 Sergio |